diff options
| author | Jakub Kotur <qtr@google.com> | 2020-12-21 17:28:15 +0100 |
|---|---|---|
| committer | Jakub Kotur <qtr@google.com> | 2021-03-05 17:24:57 +0100 |
| commit | 00e4d270b2b382c1eeb6f4bcd24b1615aa805bdd (patch) | |
| tree | a2b9db8395d7a587819e58039f5a575290b1a427 /README.md | |
| parent | 97853433079c3108a7c92b68a671575f945dd5a9 (diff) | |
| download | plotters-00e4d270b2b382c1eeb6f4bcd24b1615aa805bdd.tar.gz | |
Initial import of plotters-0.2.15.
Bug: 155309706
Change-Id: Icee25df1a8b0cb8f4a4bdff20e957aff8d47d60f
Diffstat (limited to 'README.md')
| -rw-r--r-- | README.md | 545 |
1 files changed, 545 insertions, 0 deletions
diff --git a/README.md b/README.md new file mode 100644 index 0000000..3836960 --- /dev/null +++ b/README.md @@ -0,0 +1,545 @@ +# Plotters - A Rust drawing library focus on data plotting for both WASM and native applications 🦀📈🚀 + +<a href="https://crates.io/crates/plotters"> + <img style="display: inline!important" src="https://img.shields.io/crates/v/plotters.svg"></img> +</a> +<a href="https://docs.rs/plotters"> + <img style="display: inline!important" src="https://docs.rs/plotters/badge.svg"></img> +</a> +<a href="https://plotters-rs.github.io/rustdoc/plotters/"> + <img style="display: inline! important" src="https://img.shields.io/badge/docs-development-lightgrey.svg"></img> +</a> +<a href="https://travis-ci.org/38/plotters"> + <img style="display: inline! important" src="https://travis-ci.org/38/plotters.svg?branch=master"></img> +</a> +<a href="https://codecov.io/gh/38/plotters"> + <img style="display: inline! important" src="https://codecov.io/gh/38/plotters/branch/master/graph/badge.svg" /> +</a> + +Plotters is drawing library designed for rendering figures, plots, and charts, in pure rust. Plotters supports various types of back-ends, +including bitmap, vector graph, piston window, GTK/Cairo and WebAssembly. + +- A new Plotters Developer's Guide is working in progress. The preview version is available at [here](https://plotters-rs.github.io/book). +- To try Plotters with interactive Jupyter notebook, or view [here](https://plotters-rs.github.io/plotters-doc-data/evcxr-jupyter-integration.html) for the static HTML version. +- To view the WASM example, go to this [link](https://plumberserver.com/plotters-wasm-demo/index.html) +- Currently we have all the internal code ready for console plotting, but a console based backend is still not ready. See [this example](https://github.com/38/plotters/blob/master/examples/console.rs) for how to plotting on Console with a customized backend. + +## Gallery + +To view the source code for each example, please click on the example image. + +<a href="https://github.com/38/plotters/blob/master/examples/chart.rs"> + <img src="https://plotters-rs.github.io/plotters-doc-data/sample.png" class="galleryItem" width=200px></img> +</a> + +<a href="https://github.com/38/plotters/blob/master/examples/stock.rs"> + <img src="https://plotters-rs.github.io/plotters-doc-data/stock.png" class="galleryItem" width=200px></img> +</a> + +<a href="https://github.com/38/plotters/blob/master/examples/histogram.rs"> + <img src="https://plotters-rs.github.io/plotters-doc-data/histogram.png" class="galleryItem" width=200px></img> +</a> + +<a href="https://github.com/38/plotters#quick-start"> + <img src="https://plotters-rs.github.io/plotters-doc-data/0.png" class="galleryItem" width=200px></img> +</a> + +<a href="#"> + <img src="https://plotters-rs.github.io/plotters-doc-data/console-2.png" class="galleryItem" width=200px></img> +</a> + +<a href="https://github.com/38/plotters/blob/master/examples/mandelbrot.rs"> + <img src="https://plotters-rs.github.io/plotters-doc-data/mandelbrot.png" class="galleryItem" width=200px></img> +</a> + +<a href="https://github.com/38/plotters#trying-with-jupyter-evcxr-kernel-interactively"> + <img src="https://plotters-rs.github.io/plotters-doc-data/evcxr_animation.gif" class="galleryItem" width=200px></img> +</a> + + +<a href="https://github.com/38/plotters/tree/master/examples/piston-demo"> + <img src="https://plotters-rs.github.io/plotters-doc-data/plotters-piston.gif" class="galleryItem" width=200px></img> +</a> + +<a href="https://github.com/38/plotters/blob/master/examples/normal-dist.rs"> + <img src="https://plotters-rs.github.io/plotters-doc-data/normal-dist.png" class="galleryItem" width=200px></img> +</a> + +<a href="https://github.com/38/plotters/blob/master/examples/two-scales.rs"> + <img src="https://plotters-rs.github.io/plotters-doc-data/twoscale.png" class="galleryItem" width=200px></img> +</a> + +<a href="https://github.com/38/plotters/blob/master/examples/matshow.rs"> + <img src="https://plotters-rs.github.io/plotters-doc-data/matshow.png" class="galleryItem" width=200px></img> +</a> + +<a href="https://github.com/38/plotters/blob/master/examples/sierpinski.rs"> + <img src="https://plotters-rs.github.io/plotters-doc-data/sierpinski.png" class="galleryItem" width=200px></img> +</a> + +<a href="https://github.com/38/plotters/blob/master/examples/normal-dist2.rs"> + <img src="https://plotters-rs.github.io/plotters-doc-data/normal-dist2.png" class="galleryItem" width=200px></img> +</a> + +<a href="https://github.com/38/plotters/blob/master/examples/errorbar.rs"> + <img src="https://plotters-rs.github.io/plotters-doc-data/errorbar.png" class="galleryItem" width=200px></img> +</a> + +<a href="https://github.com/38/plotters/blob/master/examples/slc-temp.rs"> + <img src="https://plotters-rs.github.io/plotters-doc-data/slc-temp.png" class="galleryItem" width=200px></img> +</a> + +<a href="https://github.com/38/plotters/blob/master/examples/area-chart.rs"> + <img src="https://plotters-rs.github.io/plotters-doc-data/area-chart.png" class="galleryItem" width=200px></img> +</a> + +<a href="https://github.com/38/plotters/blob/master/examples/snowflake.rs"> + <img src="https://plotters-rs.github.io/plotters-doc-data/snowflake.png" class="galleryItem" width=200px></img> +</a> + +<a href="https://github.com/38/plotters/blob/master/examples/animation.rs"> + <img src="https://plotters-rs.github.io/plotters-doc-data/animation.gif" class="galleryItem" width=200px></img> +</a> + +<a href="https://github.com/38/plotters/blob/master/examples/console.rs"> + <img src="https://plotters-rs.github.io/plotters-doc-data/console-example.png" class="galleryItem" width=200px></img> +</a> + +<a href="https://github.com/38/plotters/blob/master/examples/console.rs"> + <img src="https://plotters-rs.github.io/plotters-doc-data/console.png" class="galleryItem" width=200px></img> +</a> + +<a href="https://github.com/38/plotters/blob/master/examples/blit-bitmap.rs"> + <img src="https://plotters-rs.github.io/plotters-doc-data/blit-bitmap.png" class="galleryItem" width=200px></img> +</a> + +<a href="https://github.com/38/plotters/blob/master/examples/boxplot.rs"> + <img src="https://plotters-rs.github.io/plotters-doc-data/boxplot.svg" class="galleryItem" width=200px></img> +</a> + + +## Table of Contents + * [Gallery](#gallery) + * [Quick Start](#quick-start) + * [Trying with Jupyter evcxr Kernel Interactively](#trying-with-jupyter-evcxr-kernel-interactively) + * [Interactive Tutorial with Jupyter Notebook](#interactive-tutorial-with-jupyter-notebook) + * [Plotting in Rust](#plotting-in-rust) + * [Plotting on HTML5 canvas with WASM Backend](#plotting-on-html5-canvas-with-wasm-backend) + * [What types of figure are supported?](#what-types-of-figure-are-supported) + * [Concepts by examples](#concepts-by-examples) + + [Drawing Back-ends](#drawing-backends) + + [Drawing Area](#drawing-area) + + [Elements](#elements) + + [Composable Elements](#composable-elements) + + [Chart Context](#chart-context) + * [Misc](#misc) + + [Development Version](#development-version) + + [Reducing Depending Libraries && Turning Off Backends](#reducing-depending-libraries--turning-off-backends) + + [List of Features](#list-of-features) + * [FAQ List](#faq-list) + +## Quick Start + +To use Plotters, you can simply add Plotters into your `Cargo.toml` +```toml +[dependencies] +plotters = "^0.2.15" +``` + +And the following code draws a quadratic function. `src/main.rs`, + +```rust +use plotters::prelude::*; +fn main() -> Result<(), Box<dyn std::error::Error>> { + let root = BitMapBackend::new("plotters-doc-data/0.png", (640, 480)).into_drawing_area(); + root.fill(&WHITE)?; + let mut chart = ChartBuilder::on(&root) + .caption("y=x^2", ("sans-serif", 50).into_font()) + .margin(5) + .x_label_area_size(30) + .y_label_area_size(30) + .build_ranged(-1f32..1f32, -0.1f32..1f32)?; + + chart.configure_mesh().draw()?; + + chart + .draw_series(LineSeries::new( + (-50..=50).map(|x| x as f32 / 50.0).map(|x| (x, x * x)), + &RED, + ))? + .label("y = x^2") + .legend(|(x, y)| PathElement::new(vec![(x, y), (x + 20, y)], &RED)); + + chart + .configure_series_labels() + .background_style(&WHITE.mix(0.8)) + .border_style(&BLACK) + .draw()?; + + Ok(()) +} +``` + +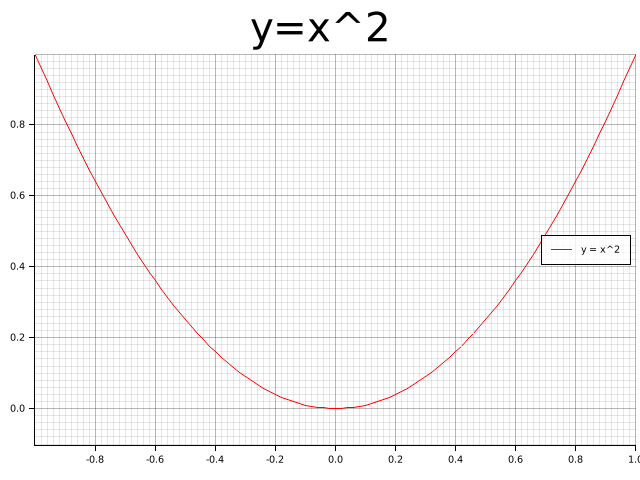 + + +## Trying with Jupyter evcxr Kernel Interactively + +Plotters now supports integrate with `evcxr` and is able to interactively drawing plots in Jupyter Notebook. +The feature `evcxr` should be enabled when including Plotters to Jupyter Notebook. + +The following code shows a minimal example of this. + +```text +:dep plotters = { git = "https://github.com/38/plotters", default_features = false, features = ["evcxr"] } +extern crate plotters; +use plotters::prelude::*; + +let figure = evcxr_figure((640, 480), |root| { + root.fill(&WHITE); + let mut chart = ChartBuilder::on(&root) + .caption("y=x^2", ("Arial", 50).into_font()) + .margin(5) + .x_label_area_size(30) + .y_label_area_size(30) + .build_ranged(-1f32..1f32, -0.1f32..1f32)?; + + chart.configure_mesh().draw()?; + + chart.draw_series(LineSeries::new( + (-50..=50).map(|x| x as f32 / 50.0).map(|x| (x, x * x)), + &RED, + )).unwrap() + .label("y = x^2") + .legend(|(x,y)| PathElement::new(vec![(x,y), (x + 20,y)], &RED)); + + chart.configure_series_labels() + .background_style(&WHITE.mix(0.8)) + .border_style(&BLACK) + .draw()?; + Ok(()) +}); +figure +``` + +<img src="https://plotters-rs.github.io/plotters-doc-data/evcxr_animation.gif" width="450px"></img> + +## Interactive Tutorial with Jupyter Notebook + +*This tutorial is now working in progress and isn't complete* + +Thanks to the evcxr, now we have an interactive tutorial for Plotters! +To use the interactive notebook, you must have Jupyter and evcxr installed on your computer. +Follow the instruction on [this page](https://github.com/google/evcxr/tree/master/evcxr_jupyter) below to install it. + +After that, you should be able to start your Jupyter server locally and load the tutorial! + +```bash +git clone https://github.com/38/plotters-doc-data +cd plotteres-doc-data +jupyter notebook +``` + +And select the notebook called `evcxr-jupyter-integration.ipynb`. + +Also, there's a static HTML version of this notebook available at the [this location](https://plumberserver.com/plotters-docs/evcxr-jupyter-integration.html) + +## Plotting in Rust + +Rust is a perfect language for data visualization. Although there are many mature visualization libraries in many different languages. +But Rust is one of the best languages fits the need. + +* **Easy to use** Rust has a very good iterator system built into the standard library. With the help of iterators, +Plotting in Rust can be as easy as most of the high-level programming languages. The Rust based plotting library +can be very easy to use. + +* **Fast** If you need rendering a figure with trillions of data points, +Rust is a good choice. Rust's performance allows you to combine data processing step +and rendering step into a single application. When plotting in high-level programming languages, +e.g. Javascript or Python, data points must be down-sampled before feeding into the plotting +program because of the performance considerations. Rust is fast enough to do the data processing and visualization +within a single program. You can also integrate the +figure rendering code into your application handling a huge amount of data and visualize it in real-time. + +* **WebAssembly Support** Rust is one of few the language with the best WASM support. Plotting in Rust could be +very useful for visualization on a web page and would have a huge performance improvement comparing to Javascript. + +## Plotting on HTML5 canvas with WASM Backend + +Plotters currently supports backend that uses the HTML5 canvas. To use the WASM support, you can simply use +`CanvasBackend` instead of other backend and all other API remains the same! + +There's a small demo for Plotters + WASM under `examples/wasm-demo` directory of this repo. +To play with the deployed version, follow this [link](https://plumberserver.com/plotters-wasm-demo/index.html). + + +## What types of figure are supported? + +Plotters is not limited to any specific type of figure. +You can create your own types of figures easily with the Plotters API. + +But Plotters provides some builtin figure types for convenience. +Currently, we support line series, point series, candlestick series, and histogram. +And the library is designed to be able to render multiple figure into a single image. +But Plotter is aimed to be a platform that is fully extendable to support any other types of figure. + +## Concepts by examples + +### Drawing Back-ends +Plotters can use different drawing back-ends, including SVG, BitMap, and even real-time rendering. For example, a bitmap drawing backend. + +```rust +use plotters::prelude::*; +fn main() -> Result<(), Box<dyn std::error::Error>> { + // Create a 800*600 bitmap and start drawing + let mut backend = BitMapBackend::new("plotters-doc-data/1.png", (300, 200)); + // And if we want SVG backend + // let backend = SVGBackend::new("output.svg", (800, 600)); + backend.draw_rect((50, 50), (200, 150), &RED, true)?; + Ok(()) +} +``` + + + +### Drawing Area +Plotters uses a concept called drawing area for layout purpose. +Plotters support multiple integrating into a single image. +This is done by creating sub-drawing-areas. + +Besides that, the drawing area also allows the customized coordinate system, by doing so, the coordinate mapping is done by the drawing area automatically. + +```rust +use plotters::prelude::*; +fn main() -> Result<(), Box<dyn std::error::Error>> { + let root_drawing_area = + BitMapBackend::new("plotters-doc-data/2.png", (300, 200)).into_drawing_area(); + // And we can split the drawing area into 3x3 grid + let child_drawing_areas = root_drawing_area.split_evenly((3, 3)); + // Then we fill the drawing area with different color + for (area, color) in child_drawing_areas.into_iter().zip(0..) { + area.fill(&Palette99::pick(color))?; + } + Ok(()) +} +``` + + + +### Elements + +In Plotters, elements are build blocks of figures. All elements are able to draw on a drawing area. +There are different types of built-in elements, like lines, texts, circles, etc. +You can also define your own element in the application code. + +You may also combine existing elements to build a complex element. + +To learn more about the element system, please read the [element module documentation](./element/index.html). + +```rust +use plotters::prelude::*; +fn main() -> Result<(), Box<dyn std::error::Error>> { + let root = BitMapBackend::new("plotters-doc-data/3.png", (300, 200)).into_drawing_area(); + root.fill(&WHITE)?; + // Draw an circle on the drawing area + root.draw(&Circle::new( + (100, 100), + 50, + Into::<ShapeStyle>::into(&GREEN).filled(), + ))?; + Ok(()) +} +``` + + + +### Composable Elements + +Besides the built-in elements, elements can be composed into a logic group we called composed elements. +When composing new elements, the upper-left corner is given in the target coordinate, and a new pixel-based +coordinate which has the upper-left corner defined as `(0,0)` is used for further element composition purpose. + +For example, we can have an element which includes a dot and its coordinate. + +```rust +use plotters::prelude::*; + +fn main() -> Result<(), Box<dyn std::error::Error>> { + let root = BitMapBackend::new("plotters-doc-data/4.png", (640, 480)).into_drawing_area(); + + root.fill(&RGBColor(240, 200, 200))?; + + let root = root.apply_coord_spec(RangedCoord::<RangedCoordf32, RangedCoordf32>::new( + 0f32..1f32, + 0f32..1f32, + (0..640, 0..480), + )); + + let dot_and_label = |x: f32, y: f32| { + return EmptyElement::at((x, y)) + + Circle::new((0, 0), 3, ShapeStyle::from(&BLACK).filled()) + + Text::new( + format!("({:.2},{:.2})", x, y), + (10, 0), + ("sans-serif", 15.0).into_font(), + ); + }; + + root.draw(&dot_and_label(0.5, 0.6))?; + root.draw(&dot_and_label(0.25, 0.33))?; + root.draw(&dot_and_label(0.8, 0.8))?; + Ok(()) +} +``` + +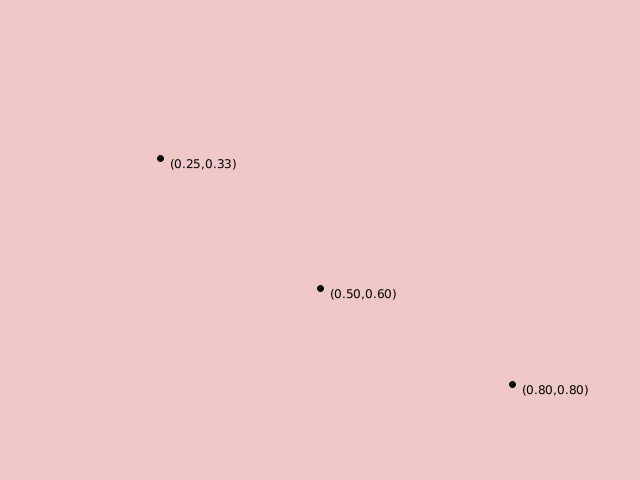 + +### Chart Context + +In order to draw a chart, Plotters need a data object built on top of the drawing area called `ChartContext`. +The chart context defines even higher level constructs compare to the drawing area. +For example, you can define the label areas, meshes, and put a data series onto the drawing area with the help +of the chart context object. + +```rust +use plotters::prelude::*; +fn main() -> Result<(), Box<dyn std::error::Error>> { + let root = BitMapBackend::new("plotters-doc-data/5.png", (640, 480)).into_drawing_area(); + root.fill(&WHITE); + let root = root.margin(10, 10, 10, 10); + // After this point, we should be able to draw construct a chart context + let mut chart = ChartBuilder::on(&root) + // Set the caption of the chart + .caption("This is our first plot", ("sans-serif", 40).into_font()) + // Set the size of the label region + .x_label_area_size(20) + .y_label_area_size(40) + // Finally attach a coordinate on the drawing area and make a chart context + .build_ranged(0f32..10f32, 0f32..10f32)?; + + // Then we can draw a mesh + chart + .configure_mesh() + // We can customize the maximum number of labels allowed for each axis + .x_labels(5) + .y_labels(5) + // We can also change the format of the label text + .y_label_formatter(&|x| format!("{:.3}", x)) + .draw()?; + + // And we can draw something in the drawing area + chart.draw_series(LineSeries::new( + vec![(0.0, 0.0), (5.0, 5.0), (8.0, 7.0)], + &RED, + ))?; + // Similarly, we can draw point series + chart.draw_series(PointSeries::of_element( + vec![(0.0, 0.0), (5.0, 5.0), (8.0, 7.0)], + 5, + &RED, + &|c, s, st| { + return EmptyElement::at(c) // We want to construct a composed element on-the-fly + + Circle::new((0,0),s,st.filled()) // At this point, the new pixel coordinate is established + + Text::new(format!("{:?}", c), (10, 0), ("sans-serif", 10).into_font()); + }, + ))?; + Ok(()) +} +``` + +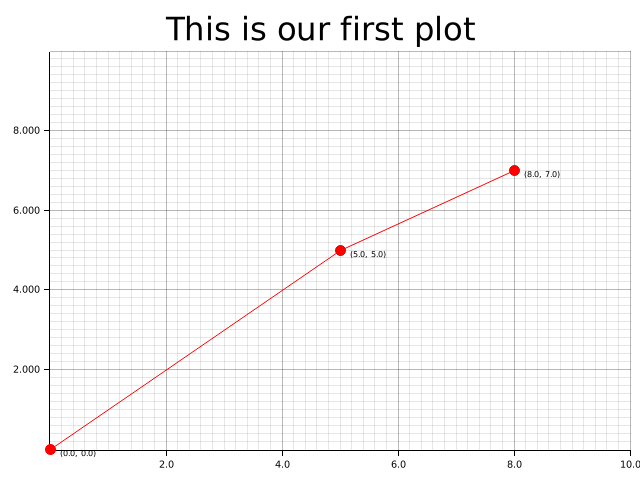 + +## Misc + +### Development Version + +To use the latest development version, pull https://github.com/38/plotters.git. In `Cargo.toml` + +```toml +[dependencies] +plotters = { git = "https://github.com/38/plotters.git" } +``` + +### Reducing Depending Libraries && Turning Off Backends +Plotters now supports use features to control the backend dependencies. By default, `BitMapBackend` and `SVGBackend` are supported, +use `default_features = false` in the dependency description in `Cargo.toml` and you can cherry-pick the backend implementations. + +- `svg` Enable the `SVGBackend` +- `bitmap` Enable the `BitMapBackend` + +For example, the following dependency description would avoid compiling with bitmap support: + +```toml +[dependencies] +plotters = { git = "https://github.com/38/plotters.git", default_features = false, features = ["svg"] } +``` + +The library also allows consumers to make use of the [`Palette`](https://crates.io/crates/palette/) crate's color types by default. +This behavior can also be turned off by setting `default_features = false`. + +### List of Features + +This is the full list of features that is defined by `Plotters` crate. +Use `default_features = false` to disable those default enabled features, +and then you should be able to cherry-pick what features you want to include into `Plotters` crate. +By doing so, you can minimize the number of dependencies down to only `itertools` and compile time is less than 6s. + +The following list is a complete list of features that can be opt in and out. + +- Drawing backends related features + +| Name | Description | Additional Dependency |Default?| +|---------|--------------|--------|------------| +| image\_encoder | Allow `BitMapBackend` save the result to bitmap files | image, rusttype, font-kit | Yes | +| svg | Enable `SVGBackend` Support | None | Yes | +| gif\_backend| Opt-in GIF animation Rendering support for `BitMapBackend`, implies `bitmap` enabled | gif | Yes | +| piston | Enable `PistonWindowBackend` | piston\_window, rusttype, font-kit | No | +| cairo | Enable `CairoBackend` | cairo-rs, rusttype, font-kit | No | + +- Font manipulation features + +| Name | Description | Additional Dependency |Default?| +|---------|--------------|--------|------------| +| ttf | Allows TrueType font support | rusttype, font-kit | Yes | + +- Coordinate features + +| Name | Description | Additional Dependency |Default?| +|---------|--------------|--------|------------| +| datetime | Eanble the date and time coordinate support | chrono | Yes | + +- Element, series and util functions + +| Name | Description | Additional Dependency |Default?| +|---------|--------------|--------|------------| +| errorbar | The errorbar element support | None | Yes | +| candlestick | The candlestick element support | None | Yes | +| boxplot | The boxplot element support | None | Yes | +| area\_series | The area series support | None | Yes | +| line\_series | The line series support | None | Yes | +| histogram | The histogram series support | None | Yes | +| point\_series| The point series support | None | Yes | + +- Misc + +| Name | Description | Additional Dependency |Default?| +|---------|--------------|--------|------------| +| deprecated\_items | This feature allows use of deprecated items which is going to be removed in the future | None | Yes | +| debug | Enable the code used for debugging | None | No | + + +## FAQ List + +* Why does the WASM example break on my machine ? + + The WASM example requires using `wasm32` target to build. Using `cargo build` is likely to use the default target + which in most of the case is any of the x86 target. Thus you need add `--target=wasm32-unknown-unknown` in the cargo + parameter list to build it. + +* How to draw text/circle/point/rectangle/... on the top of chart ? + + As you may realized, Plotters is a drawing library rather than a traditional data plotting library, + you have the freedom to draw anything you want on the drawing area. + Use `DrawingArea::draw` to draw any element on the drawing area. + + |